BDSwiss App
Download & start trading

Rates as of 05:00 GMT
Market Recap
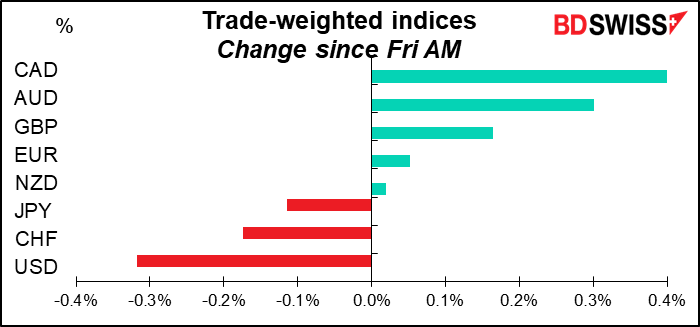
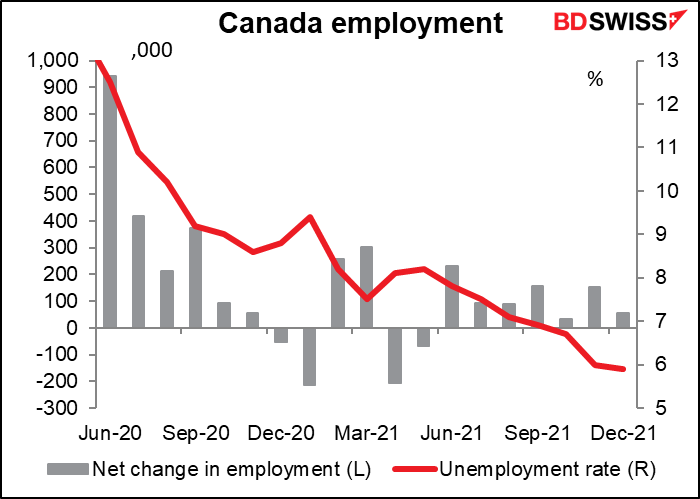
CAD is largely an oil currency, but not entirely. It managed to be the best-performing currency today despite a 1.3% fall in the price of oil. The reason was Friday’s excellent Canada employment data, which showed about twice as many jobs created as expected (54.7k vs 25k) and the unemployment rate dropping to 5.9% from 6.0% (expected unchanged). Since the Bank of Canada now has a “dual mandate” in which “monetary policy should continue to support maximum sustainable employment,” that makes tightening policy a little easier.
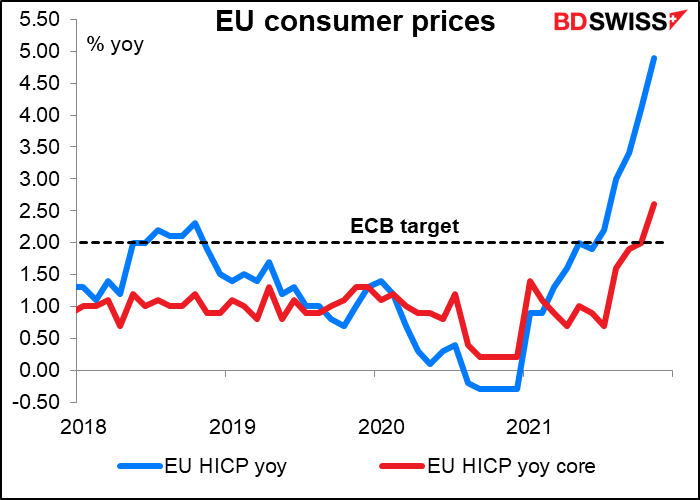
EUR gained after Friday’s EU-wide consumer price index (CPI) hit 5.0% yoy, the highest it’s been since the Eurozone was established in 1998. (It was expected to fall to 4.8% from 4.9%.) But much of that was just surging energy prices. Core CPI, which excludes food and energy, was unchanged at 2.6% yoy. European Central Bank (ECB) Chief Economist Lane dismissed the rise as chiefly due to higher energy prices and reiterated the ECB’s view that inflation will decline later this year, meaning that they still don’t intend to hike rates this year. The market thinks differently, but apparently his reassurance was enough to keep EUR from rising very much.
JPY fell despite the best efforts of the government with “verbal intervention. Reuters said that Finance Minister Suzuki Friday called for “stability” in the FX market. “I won’t comment on the currency market itself, but stability is important above all,” Suzuki told reporters. “From that standpoint, we’ll closely watch currency market moves and their impact on the Japanese economy,” he said, when asked if the weakening yen was negative for the economy.
As for the dollar, it fell despite signs that the Fed may withdraw its aid to the economy faster than expected, hiking rates soon after it finishes tapering down its bond purchases and starting to shrink its balance sheet soon after it starts hiking rates. In other words, it may compress into one year a process that last time around (2013-2017) took nearly four.
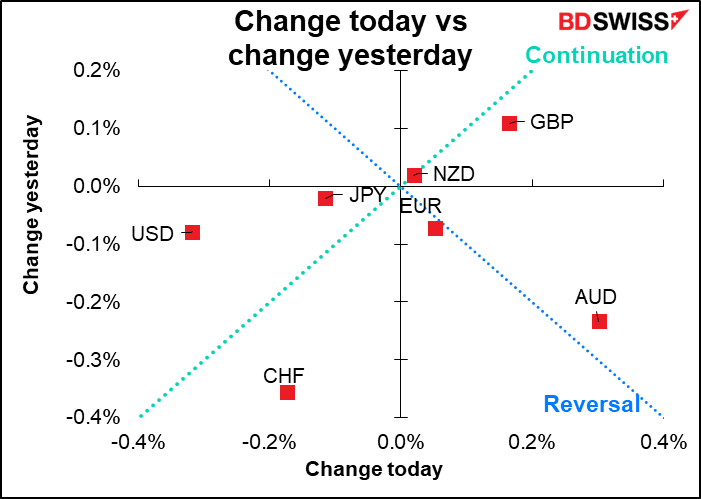
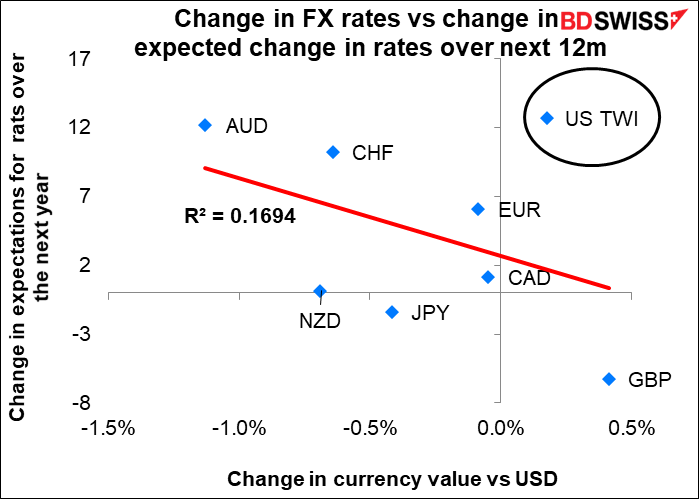
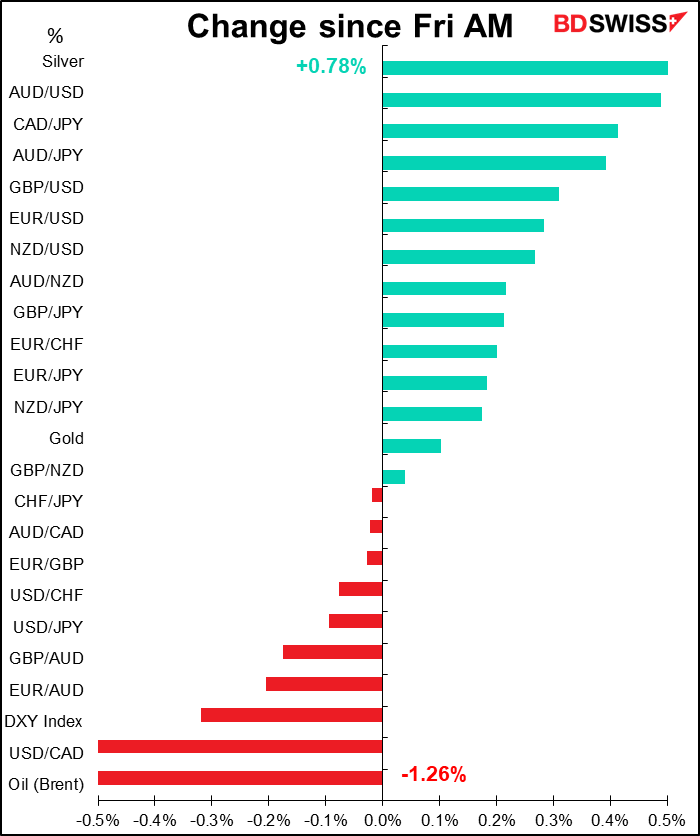
I must admit I’m somewhat confounded as to why this should be negative for the dollar – usually, expectations of higher interest rates are beneficial for a currency, and indeed USD was the outlier in that respect last week in that it wasn’t (see below). I can only surmise that the market is also prioritizing growth and perhaps thinks that the Fed being behind the curve now is going to have to over-tighten, thereby sending the US into recession. But if so, why did the long bond have the worst week on record last week? So that explanation doesn’t hold water, either.
I’m also confused at the fall in JPY and CHF vs the rise in AUD – while the movement higher in bond yields may be typical of a “risk-on” mood, the response of stock markets wasn’t. It looks like stocks may be getting worried about the risks from higher interest rates and less liquidity.
A word (or two) about Friday’s US nonfarm payrolls
Friday’s US nonfarm payroll figure was below estimates – there were only 199k new jobs added, far below the median estimate of 450k. This was the lowest figure of 2021 and far below the average of 568k.
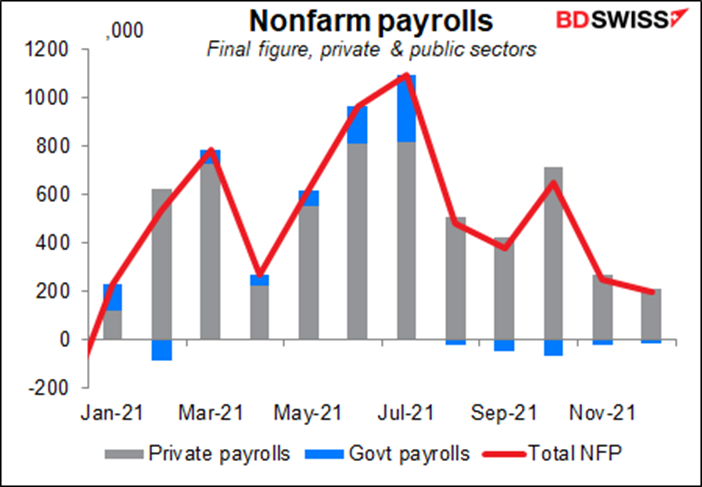
While many reports label this as a “disappointing” figure, I think this is a strange way of looking at it. The figure didn’t miss estimates; rather, the estimates missed the figure. The problem wasn’t that too few jobs were created, but rather that economists’ models of the nonfarm payrolls are no longer working under current conditions. That means economists have a problem, not the labor market.
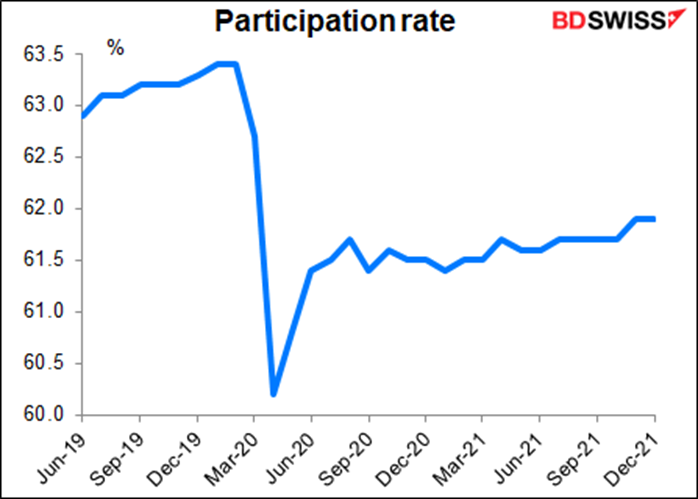
If you look at the participation rate – the percentage of people in the labor force (unemployed plus those working) who are actually working – it’s been pretty stable. Creeping up slowing but not that dramatic a change. This suggests to me that the reason why not more jobs were created was because of a lack of supply of labor, not lack of demand. If not many more people want to work, then the US is near “maximum employment” already, no?
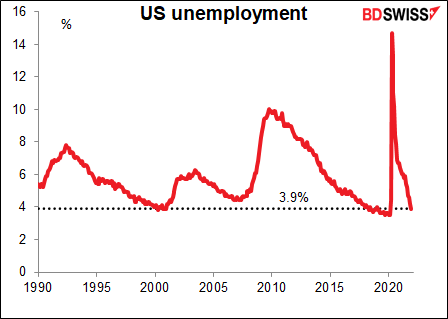
Meanwhile, the unemployment rate fell from 4.2% to 3.9%, a level that’s rarely been achieved in the last several decades. It was 3.5% before the pandemic hit. Note that the rate-setting Federal Open Market Committee (FOMC) forecast that it would be back to 3.5% by the end of 2022. The US is almost there a year early.
There’s been a big change in the relationship between the participation rate and the unemployment rate. Ever since the pandemic hit, participation has been much lower for any given level of unemployment. I think this indicates less willingness to work. Given the threat to one’s life by working with the US public nowadays, people who refuse to put on a mask and often assault workers when asked to do so, it’s entirely understandable to me.

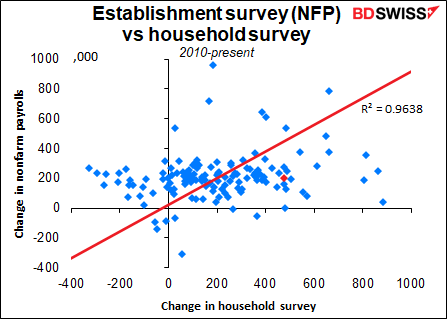
How can the unemployment rate drop so much when so few new jobs are created? The reason is that the two figures come from different sources. The NFP comes from the Establishment Survey. The Bureau of Labor Statistics (BLS) calls up some 40% of US companies – virtually all big ones and many many medium- and small-sized ones – and asks them how many people are on their payrolls. The unemployment rate comes from the Household Survey – the BLS calls up some 20,000 households and asks who’s working. As the graph shows, over time the changes in the two are nearly identical – the red trend line is almost exactly at 450 and passes pretty close to the zero intersection. However for any given month there can be a big difference between the change the two. The red dot shows the latest month. NFP was up only 199k but the Household Survey showed an increase of 476k jobs.
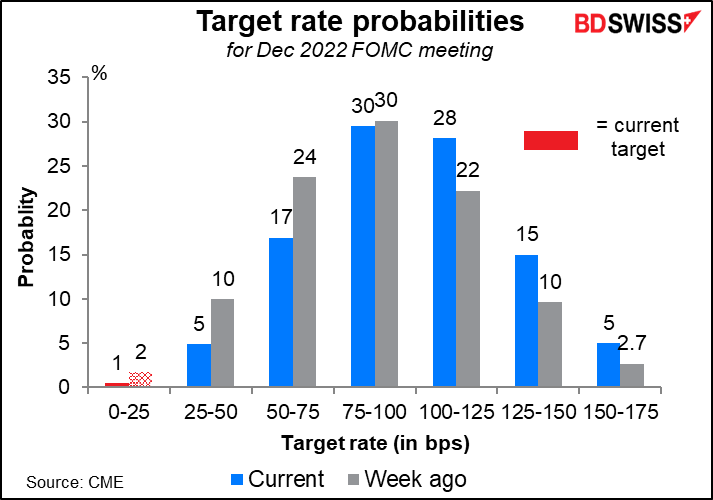
In any event, the market decided that the NFP wasn’t bad enough to deflect the Fed from its hiking path and indeed the plunge in the unemployment rate and continued high rate of growth in average earnings (+4.7% yoy) probably made a faster pace of tightening more likely. The market now thinks there’s almost as much of a chance of four rate hikes this year as there is of three, and there’s even a non-negligible possibility of five. As a result, bond yields went shooting higher as the market now assumes that the Fed may even start reducing its balance sheet this year (quantitative tightening).
The rise in bond yields didn’t have much correlation with the moves in the FX market last week, though. What did was the change in the expected change in policy rates over the next 12 months. That determined 54% of the move in currencies last week. However, the USD was an outlier in this move. If we include the USD in our calculation, the attribution drops to 17%.
Commitments of Traders (CoT) report
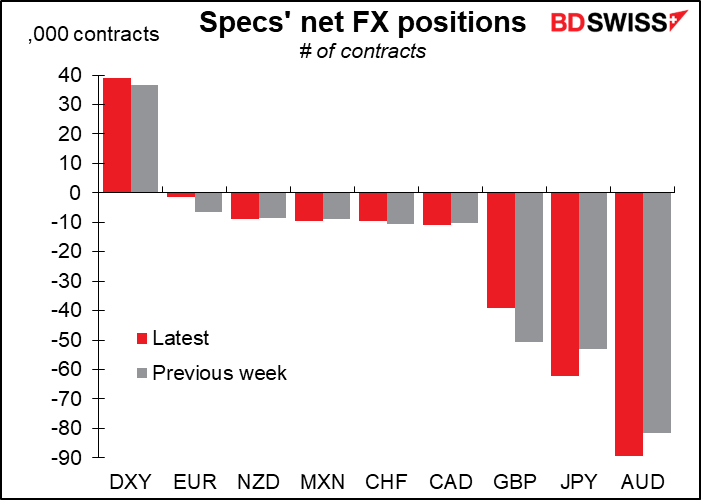
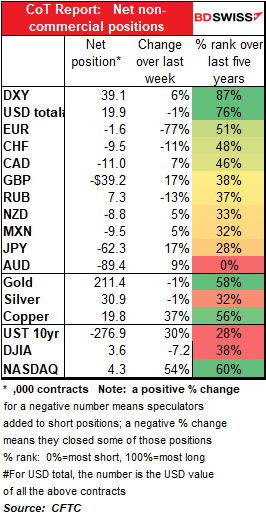
The CoT report showed only a small net decline in long USD positions, but with some big changes in individual currencies. Traders cut their net short EUR and GBP positions a lot, but offset that by increasing their short AUD and JPY.
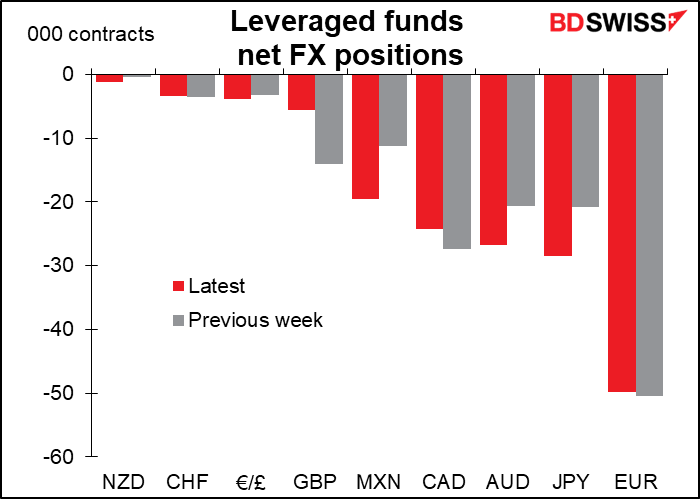
Hedge funds are short everything, much to my surprise. They increased their short JPY, AUD, and MXN positions while decreasing their short CAD and GBP.
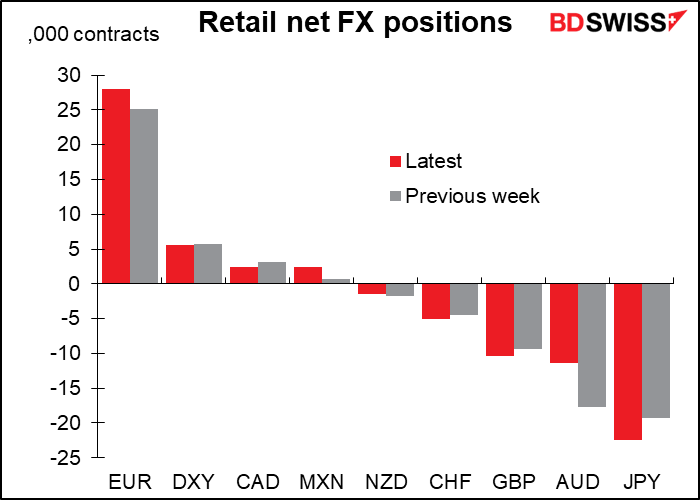
Retail investors also increased their short JPY but trimmed their short AUD. They also increased their long EUR position.
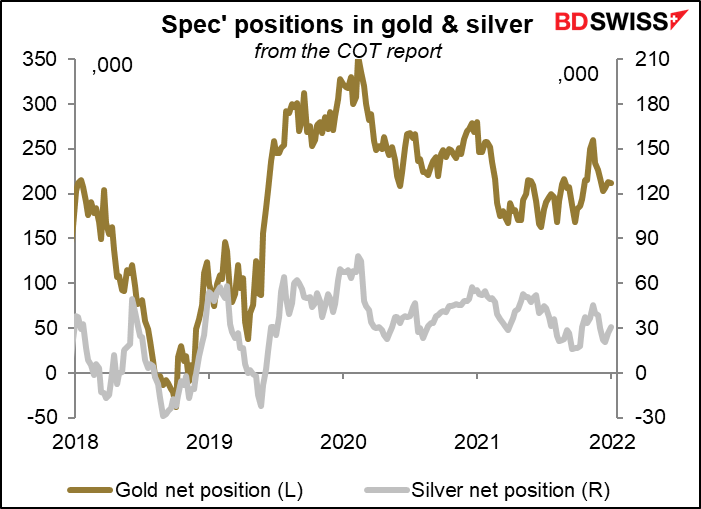
Speculators slightly increased their holdings of gold and silver.
Today’s market
Note: The table above is updated before publication with the latest consensus forecasts. However, the text & charts are prepared ahead of time. Therefore there can be discrepancies between the forecasts given in the table above and in the text & charts.
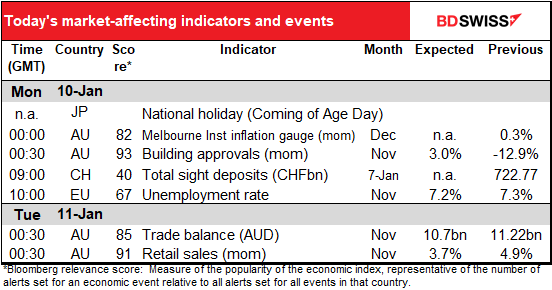
Today is a holiday in Japan, Coming of Age Day. It’s a day when all the people who turn 20 during the year (the age of majority) get dressed up and go to the City Hall or someplace similar to hear speeches about how they’re now responsible citizens. It’s among my favorite Japanese holiday because a lot of women get decked out in extremely colorful long-sleeved kimono and walk around in groups in the park. They look for all the world like flocks of butterflies. It’s great!

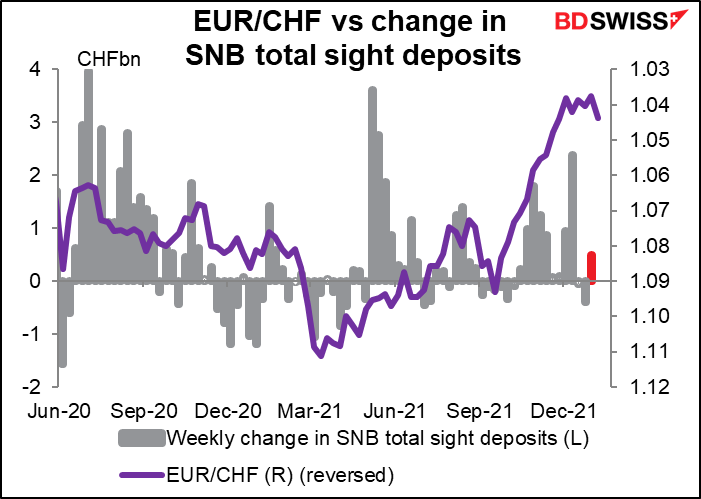
Still little action in the Swiss sight deposits. The Swiss National Bank (SMB) seems to have been a bit more active in the latest week and EUR/CHF did move up a bit, but I’m not sure that a) was big enough to cause b).
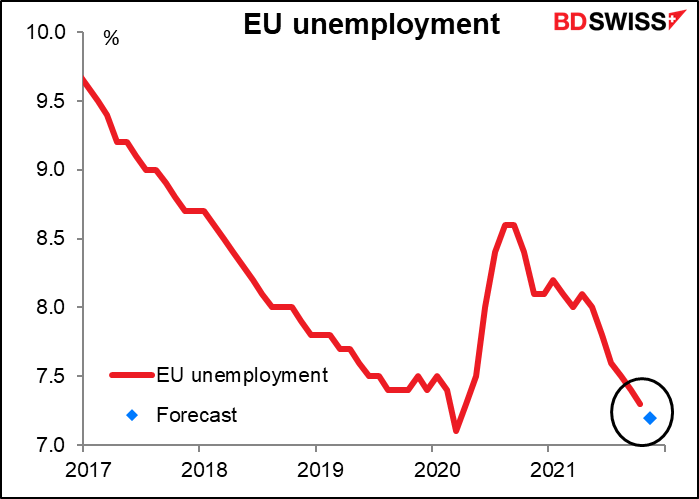
EU-wide unemployment is expected to decline further. This isn’t a big market mover, but it’s nice to know for judging the state of the economy. The European Central Bank (ECB) doesn’t have a dual mandate so technically it isn’t required to consider employment in plotting monetary policy, unlike the Fed or the Bank of Canada (since last month). A falling unemployment rate therefore doesn’t make a tighter monetary policy any more likely.
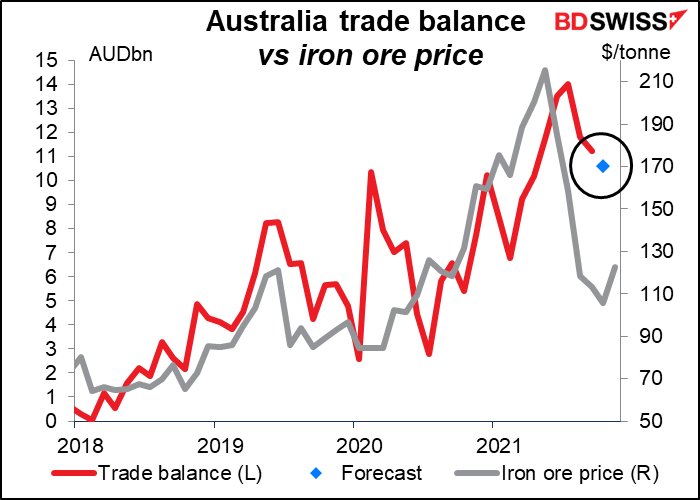
Australia’s trade surplus is expected to come down somewhat.
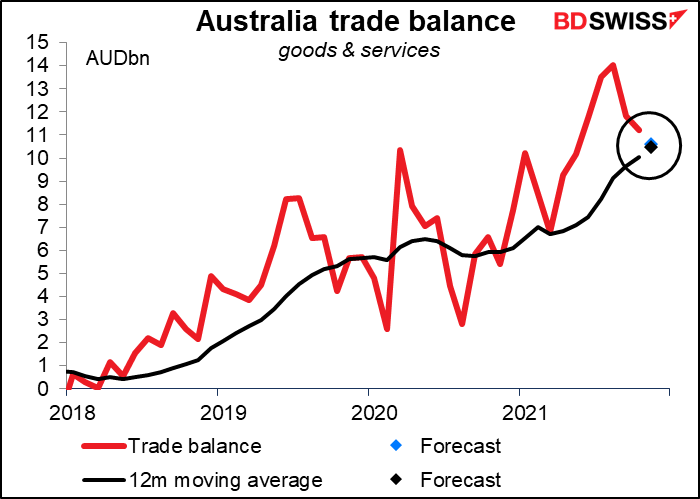
I wouldn’t be surprised if this were due to the fall in the price of iron ore, which accounted for 37% of total exports in the year to October.
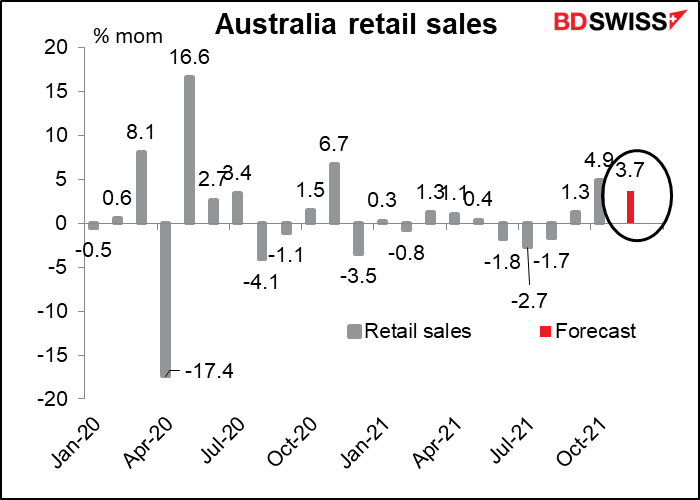
Australia retail sales are expected to be up a pretty robust 3.7% mom in November. That’s pretty good considering much of the country was in lockdown during the period. Still, people will be more interested in seeing the December data, most of which came after lockdown was relaxed.
 Marshall Gittler
Posted on 24 April, 2024 at 15:53 GMT
Posted on 23 April, 2024 at 11:46 GMT
Posted on 22 April, 2024 at 14:46 GMT
Posted on 19 April, 2024 at 13:15 GMT
Posted on 18 April, 2024 at 13:00 GMT